Try as we might to setup our data collection software correctly and use a repeatable field data collection protocol to collect high accuracy data, there’s not much we can do to prevent GNSS errors from creeping into our features. The only users who can almost avoid this are those who perform their field work in a completely open environment. This is one in which there are no obstructions higher than the GNSS antenna and the data capture is performed perfectly by an experienced user.
Short of this, there are going to be errors in your dataset, most of which you can remove before sending it to GIS or CAD.
Let’s say you are collecting data in a moderately open area where hills and some trees are present. Let’s also say you are using a handheld GNSS mapping system with no external antenna. This is certainly a common environment in the Pacific Northwest and in many other areas. When you bring your data back into the office and look at it in Pathfinder Office, you notice that some of your features don’t look right. Here are some recommended steps you can go through to insure that you are exporting your best data when it comes time to send it to GIS.
The first step is to perform differential correction, assuming that you did not have a real time correction source in the field. You post process the data file with a base station close enough to your project site to achieve the rated accuracy of your field device. Let’s also assume that the base station file contained both GPS and GLONASS data with an integrity index of 80 or higher. This is ideal when selecting a base station when using a multi-constellation GNSS receiver.
You open the corrected file in the Pathfinder Office Map window and check your file visually. Does it look like it’s supposed to, based on how and where you collected the data? Okay; check.
Now, let’s look at the standard deviation of each point feature. The standard deviation is a precision value calculated by Pathfinder Office that reflects how closely the individual GNSS positions were able to repeat to themselves. In other words, if you were using a Geo7X, H-Star receiver, you would want very small numbers to be revealed; .2 feet, .3 feet, .6 feet, etc. Here is how Pathfinder Office calculates that value:
If you collected 10 positions for the point feature, the software spatially averages those positions to come up with a single location. From that location, it measures a distance to each of the positions in the group, and then displays the average distance. Example: the standard deviation is .7 feet. This means that theoretically, one of the 10 positions was right on the average location, and one of the positions was 1.4 feet away from that location. The averaged distance would be .7 feet.
It’s common for an organization to come up with a policy that dictates, possibly for a single project, what an acceptable standard deviation should be. If using a very accurate GNSS receiver, the acceptable number would probably be quite low. If using a 2-5 meter mapping system like a Juno3B, the number would necessarily have to be higher simply because a receiver of that type could not consistently produce more accurate results.
It’s important that before you export your data file to GIS or CAD, you check the standard deviation of every point feature. Here’s how you do it:
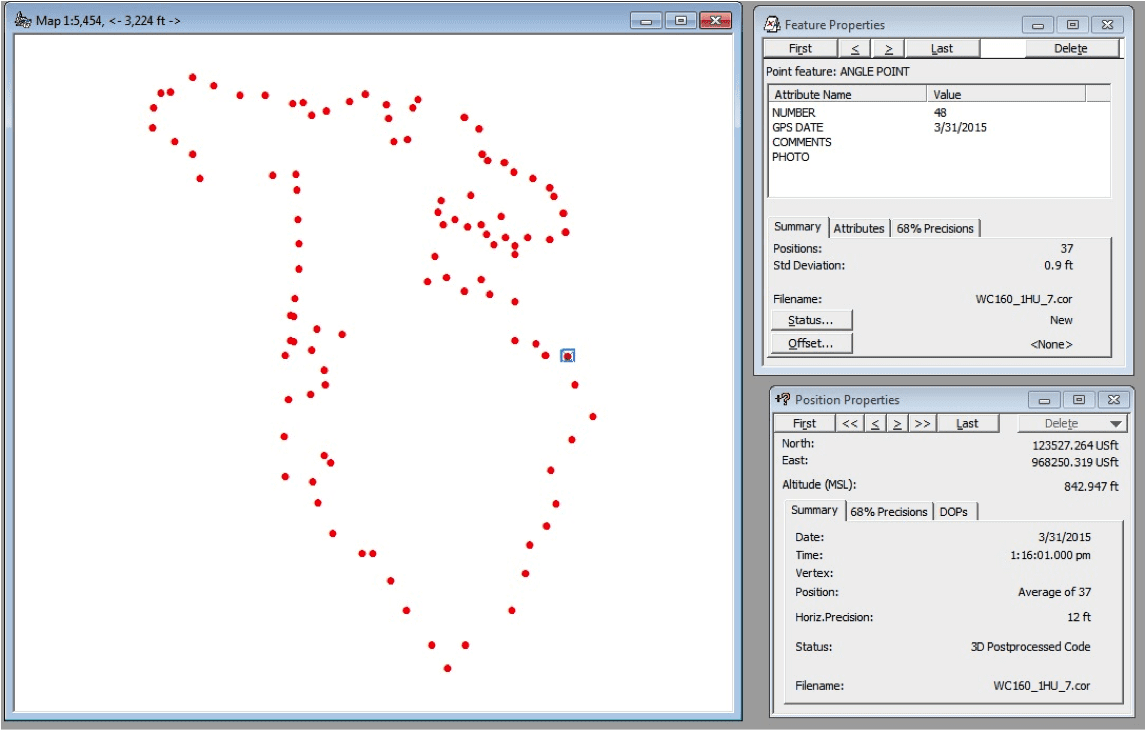
Notice that a point feature has been selected. The standard deviation value is shown in the Feature Properties dialog. In this case, there are 37 positions in the feature and the standard deviation is .9 feet. This data was collected with a Trimble Geo7X, H-Star receiver in a very heavy tree canopy. I would be happy with this value based on the accuracy of the instrument used to collect the data and the environment in which it was collected. I would not recommend that any editing be done to this feature.
Now let’s look at a point feature that doesn’t look so good.

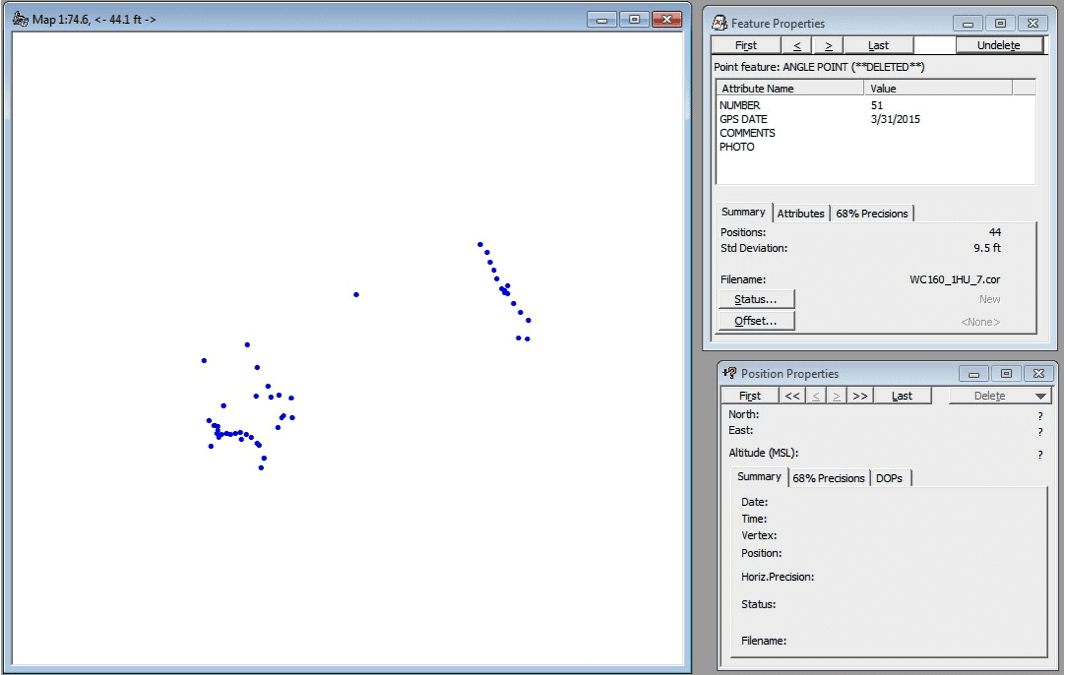
This point feature contains 44 positions with a standard deviation of 9.5 feet. I would edit this feature by taking a look at the positions that make up the feature and see if I could determine if it contained multipath or any outliers that should be deleted. Let’s get started:
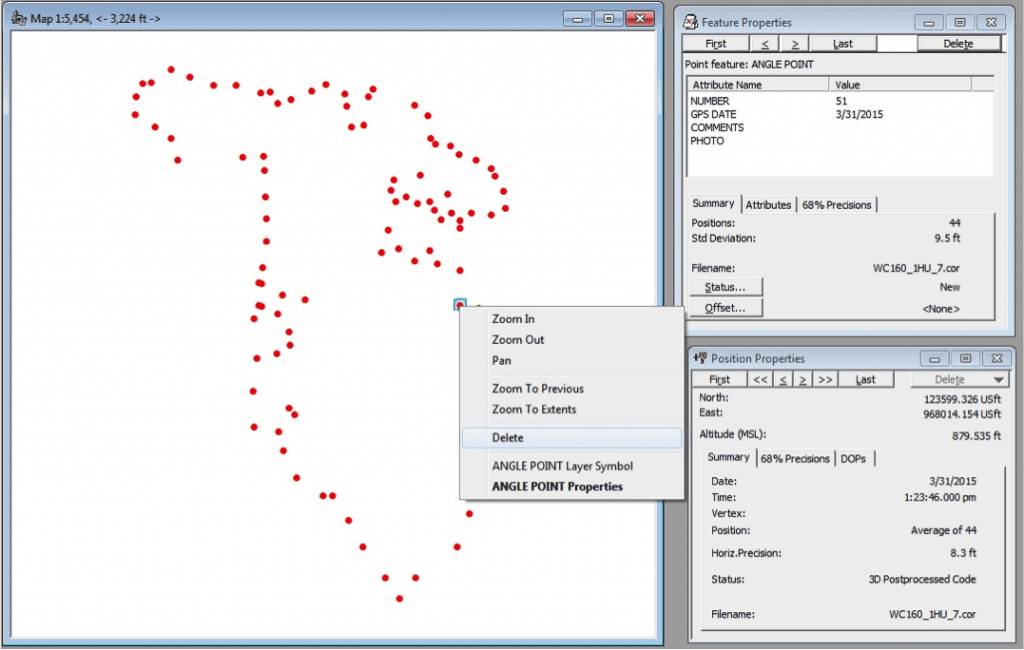
Right-click on the feature and select Delete. The software will ask you if you want to delete the feature, and you select yes.
Revealed, are the 44 positions that make up the point feature, but they are difficult to see. So let’s choose a position symbol that makes them easier to view.
To do this, go to the View menu, then Layers, then Features.
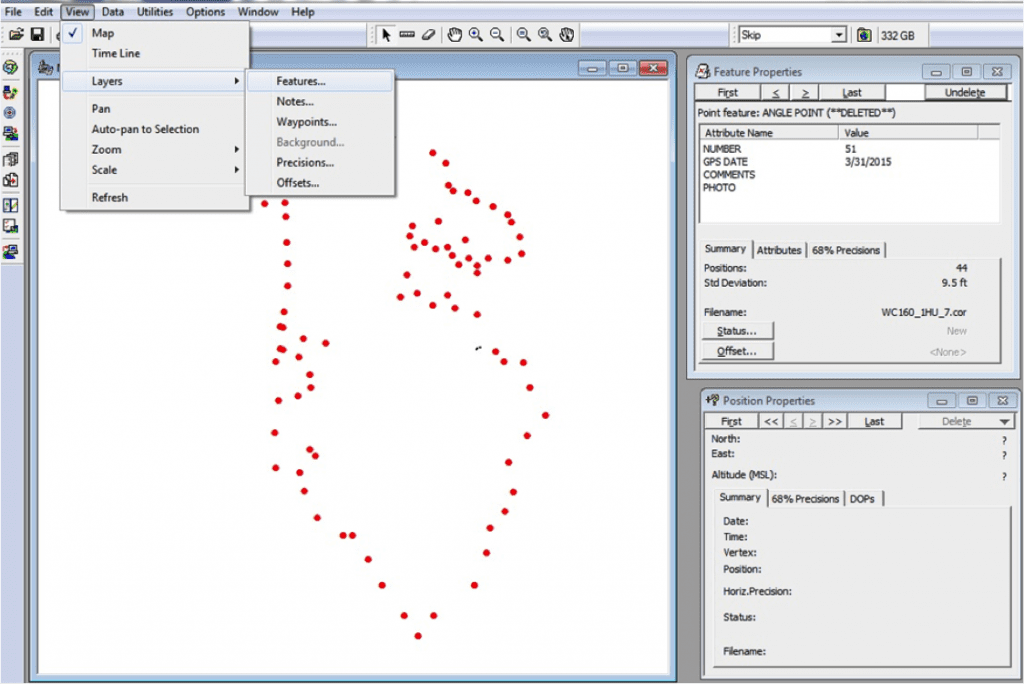
Select the line, “Not in Feature,” and then Line Type and choose a bright color. Take a look at the pattern. Is it an evenly distributed scatter plot, or an irregular scatter plot?
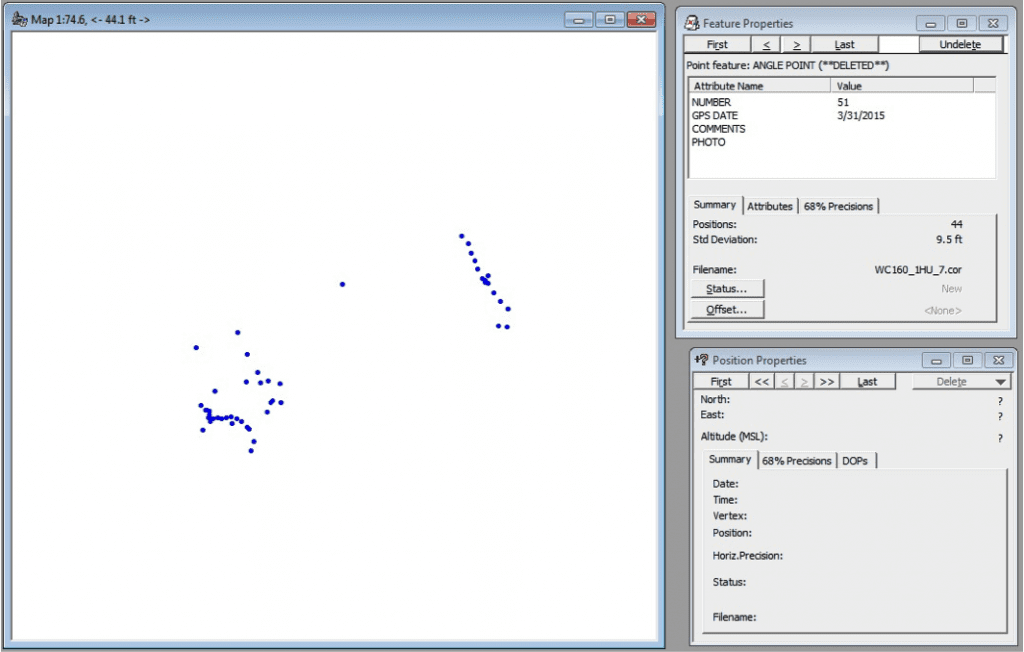
Let’s zoom in to take a closer look.

You may remember that the weakest component of a three dimensional GNSS position is in the vertical. The typical relationship between vertical and horizontal accuracy is 2 to 1, or 3 to 1. This means that the vertical accuracy can be two or three times worse than the horizontal accuracy. So, one way to check to see if any positions are the result of multipath, is to check the elevation (when set to MSL) of the positions in the main cluster, vs. the positions that are off by themselves.
Another big indicator that there is multipath in the feature is to look for a linear pattern of positions as in the above example. Here’s why this occurs.
When you are standing still over a point collecting positions, the satellites are in motion. They are moving at approximately 8,500 MPH, they move a considerable distance in a short time. When a satellite signal bounces off a tree or rock, and then goes into your antenna, there is too much travel time in that signal. Since we determine an accurate distance from each satellite by measuring how long it took the signal to reach our antenna, an extra bounce (additional travel time) will cause errors in our position. Because you are standing still and the satellite is moving, the angle of bounce manifests as a linear pattern of positions. The pattern could be straight or slightly curved, but generally linear.
Checking the elevation of the positions in the general cluster and comparing them to the elevation in the positions in the linear pattern, we find there is quite a difference. Because the error in the vertical is the worst component of the three-dimensional positions, you will see a wild difference in the elevation value of multipath positions.
General elevations in the cluster: 860 feet. General elevations in the linear pattern: 910.
This confirms that we do have multipath in our point feature for three reasons: 1) the standard deviation is high (you have to be careful with this one, because a high standard deviation does not confirm that we have a “bad” point, but it can be an indicator), 2) we see a linear pattern of positions in the group, and 3) we see a significant difference in elevation between the majority of positions and the ones in the linear pattern.
So here’s what we can do. Once we determine that there are some positions that should be removed from the point feature, we can delete them. Use the Delete Block tool to accomplish this.
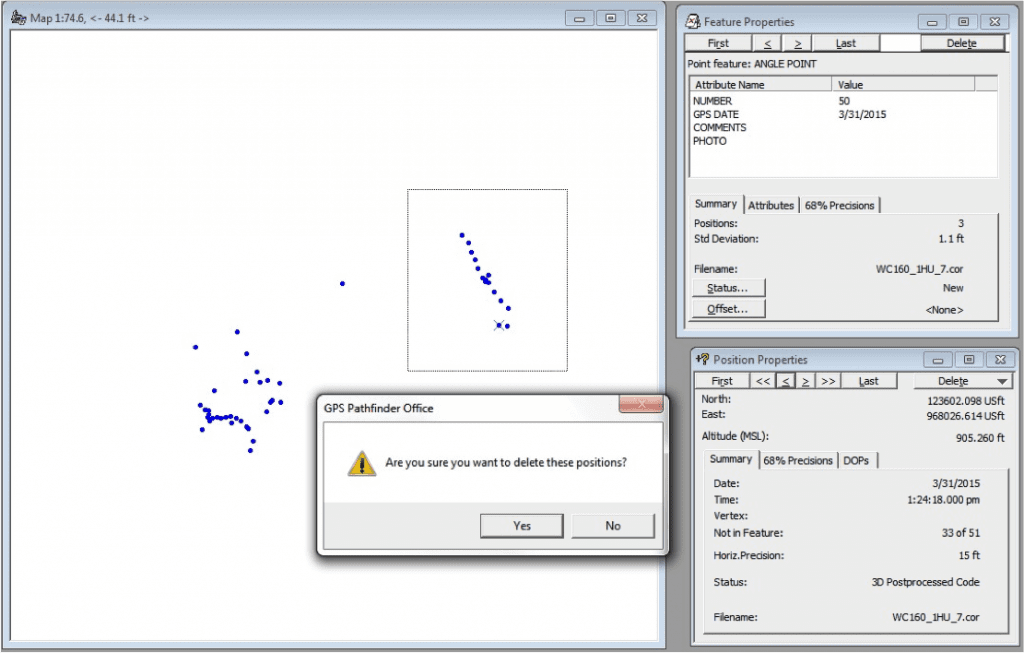
You can delete that single position outside the box by simply right clicking on the position with your Select tool (mouse arrow), right-click, and then select Delete Position.
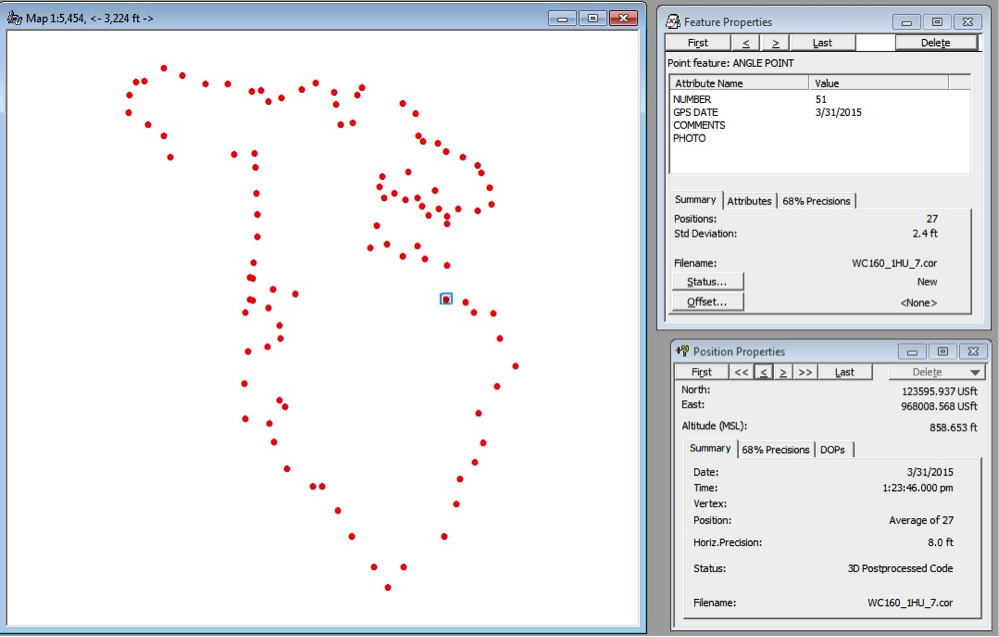
Once the offending positions are gone, you can go back to the Feature Properties dialog and click on the Undelete button in the upper right corner. This will bring the feature back on the map window again by re-averaging the remaining positions. This has the effect of physically moving the feature to its correct location.
You can see how those outliers would have a statistical effect on the average location of that feature. With those positions gone, the feature assumes its rightful place on the map.
Before I deleted the positions, I used the Measuring tool to see how far apart the positions were in the entire group. That measurement was 22.5 feet. That was quite a wide spread while remaining stationary collecting 44 positions.
After deleting the outliers, the standard deviation went down to 2.4 feet.
In order to determine which positions should be deleted, I made a judgement call based on the criteria I outlined. Of course, the question is, “Did I do the right thing?”
The idea behind editing point features in Pathfinder Office is NOT to get a lower standard deviation. The idea is to use these indicators to investigate the point features to see if they warrant taking a closer look at in order to improve the location of the features.
There is also the fact that we can take advantage of GNSS statistical data while in Pathfinder Office to make these editing decisions, rather than manually moving the point feature to where you thing it should be when in ArcGIS.
When working in open environments, this editing technique is rarely used. But, when working in very obstructed environments, it’s a handy tool to have at your disposal.
Solutions
Frontier Precision provides world-class solutions for a wide variety of industries using leading products, training, technical services and more.


Products
Technical Services
If you require customized technical services and training, please contact Frontier Precision at 800-359-3703 or reach out to a local Frontier Precision location.
Training and Events
Frontier Precision offers affordable regularly scheduled certified training classes, online eLearning, webinars, as well as custom training options to meet your specific training needs.
About Frontier Precision
Contact Frontier Precision