FRONTIER PRECISION SERVICE TERMS AND CONDITIONS OF USE AND SERVICE
Effective Date: July 1, 2020
WHEN YOU ELECT TO PURCHASE OUR SUBSCRIPTION SERVICES OR USE OUR FREE TRIAL VIA OUR WEBSITE, YOU ARE AGREEING TO FOLLOWING TERMS AND CONDITIONS OF USE AND SERVICE (COLLECTIVELY, “TERMS OF SERVICE”). THIS IS AN OPT-IN PROCESS INCLUSIVE TO THE ORDER PLACED BY YOU FOR SUCH SUBSCRIPTION SERVICES.
PLEASE READ CAREFULLY
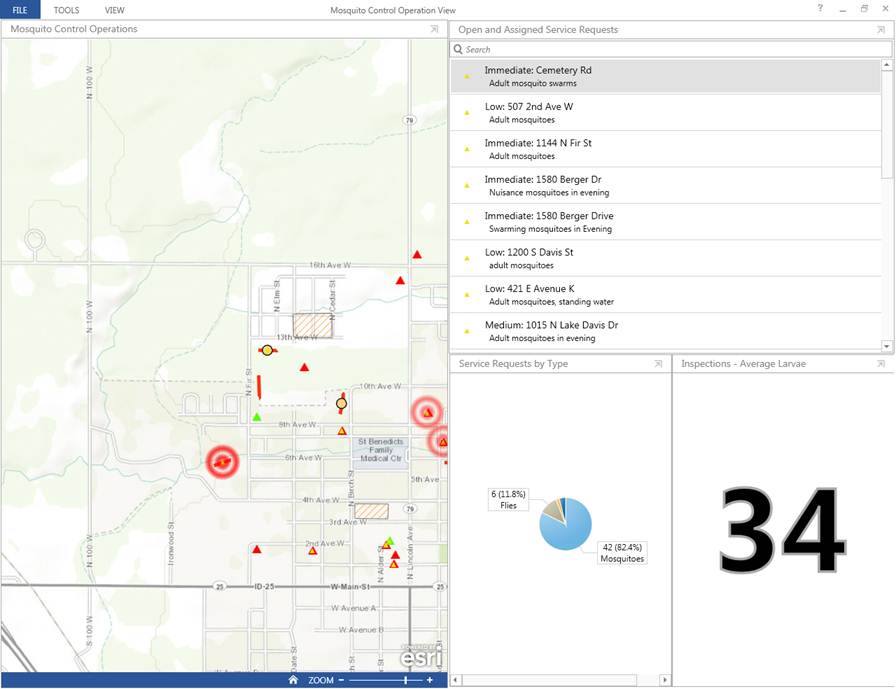
Welcome to Frontier Precision, Inc., LP, d/b/a “Frontier Precision” (“Frontier Precision” or “we” or “our” or “us”). We offer a service that provides our subscribers with access to the following features: Learning Lab videos, webinars, training materials, articles and other informational materials stored in the Frontier Precision Learning Lab.
These Terms of Service are a legally binding contract between you and Frontier Precision pertaining to, among other things, the access to and use of any subscription services, support services and any related information, content and electronic documentation (collectively, the “Services”) made available or provided from the website www.frontierprecision.com.com (or any portals or sub-domains thereof) or other websites operated by or for Frontier Precision (collectively, the “Sites”).
If you are a resident of the United States (including its possessions and territories), you agree to the Arbitration Agreement and class action waiver described in these Terms of Services to resolve any disputes with Frontier Precision (except for matters that may be taken to small claims court).
Please note that these Terms of Service include hyperlinks that may be accessed only through our website. These Terms of Service also incorporate by reference our Privacy Policy, which may be viewed at www.frontierprecision.com, and which governs the use of information (including personally identifiable information and cookies) in connection with the Services.
Electronic Signature Consent to these Terms of Service and Orders
Your access to the Sites or use of the Services constitutes your acceptance of these Terms of Service. By clicking on the “I AGREE” or “I CONSENT” button or other indicator of your electronic acceptance of these Terms of Service, you agree to conduct each transaction by electronic means and Frontier Precision and you hereby state that electronic signatures shall have the same force and effect as original or hand-written signatures with respect to these Terms of Service and all electronic records or transactions entered into between you and Frontier Precision with respect to the Sites and Services offered to you by Frontier Precision. You hereby affirm your intent to conduct transactions using electronic signatures and records. You may revoke approval of this electronic signature process at any time with prior written notice to Frontier Precision ; however this will result in Frontier Precision suspension or termination of all transactions and/or access or use of the Sites or Services absent your acknowledgment of agreement or consent by other valid legal means.
Changes to Terms of Service. Frontier Precision may, from time to time, change these Terms of Service, including the Privacy Policy. Such revisions shall be effective immediately; provided however, for existing subscribers, such revisions shall, unless otherwise stated, be effective 30 days after posting. We will endeavor to post prior versions of the Terms of Service, if any, for the preceding 12-month period. While Frontier Precision may send written notice of any such changes, it is your responsibility to keep up-to-date with and adhere to the posted Terms of Service. Your continued access to the Site or use of the Services following any such change constitutes your acknowledgement of such change and your agreement to follow and be bound by the modified terms and conditions, if any.
Communication Preferences. By using the Frontier Precision service, you consent to receiving electronic communications from Frontier Precision relating to your account. These communications may involve sending emails to your email address provided during registration, or posting communications on the Frontier Precision service, or in the “Your Account” page and will include notices about your account (e.g., payment authorizations, change in password or payment method, confirmation e-mails and other transactional information) and are part of your relationship with Frontier Precision . You agree that any notices, agreements, disclosures or other communications that we send to you electronically will satisfy any legal communication requirements, including that such communications be in writing. You should maintain copies of electronic communications by printing a paper copy or saving an electronic copy. You also consent to receiving certain other communications from us, such as newsletters about new Frontier Precision features and content, special offers, promotional announcements and surveys via email or other methods. You also consent to receiving phone calls related to scheduled live technical assistance sessions you may request as part of the Frontier Precision Service; you also consent to receiving calls from our billing department to resolve any billing issues that may arise with your subscription. Please review our Privacy Policy (www.frontierprecision.com/privacypolicy) for further detail on our marketing communications.
Account Set-Up
Establishing an Account. Browsing of the Site’s public pages is currently provided free of charge to any person. However, access to the Services will require an account to be first established and activated. You may sign up for an account by completing the online order forms required by Frontier Precision and following the directions to submit a request to become a subscriber and set up an account. As part of the account activation process, you must certify that you are 18 years of age or older. When you register for an account, you will be asked to create a unique user name and password, and enter a valid email address for your account. You will be asked whether you have read and agree to abide by these Terms of Service and any additional terms set forth on the account set up page. If you answer “I agree” and you otherwise are eligible, your account may be activated. If you answer “I Do Not Agree” or otherwise are not eligible, your account will not be activated and you will not be permitted to access the Services online.
Activation. Frontier Precision reserves the right to decline to activate an account for any person for any reason. If your account is activated, you will receive a notification email immediately after you register. Once you have confirmed, you will be permitted to log in, view, load, and use the Services and the specific features of the Services for which you have been registered. By making such confirmation, you acknowledge that you have read these Terms of Service, understand your rights and obligations, and agree to be bound by these Terms of Service. You acknowledge that certain Services will be provided subject to additional terms and conditions and user limitations shown in the order confirming your subscription to, and all supported computers or devices covered by, the Services (each an “Order”) and you agree that you will abide by such additional terms and conditions applicable to the Services shown in each Order. You and Frontier Precision agree that the Services will be made available to you for use in conjunction with the number of computers set forth in the Order. Additional computers may be added by the execution of a separate Order. You acknowledge that the Services are neither contingent on the delivery of any future functionality or features nor dependent on any oral or written public comments made by Frontier Precision regarding future functionality or features other than as specifically noted on the Order.
Password Protection. You must have a password to access the Services online via your account. You are responsible for maintaining the secrecy of your password and protecting against unauthorized use of your password. You also are responsible for all activities that occur under your password and user name or your account made by you or others. You will immediately notify Frontier Precision if your password is lost, stolen, disclosed to an unauthorized third party or otherwise has been compromised or if there is any other breach of security. You will be permitted to access only those portions of the Services and the Sites for which you have been granted permission to use by Frontier Precision.
Account Requirements. In consideration of your use of the Sites and the Services, you agree to: (i) provide true, accurate, current, and complete information about yourself as prompted by our account activation form; and (ii) maintain and promptly update such account information to keep it true, accurate, current, and complete. If you provide any information that is untrue, inaccurate, not current or incomplete, or we have reasonable grounds to suspect that such account information is untrue, inaccurate, not current or incomplete, we reserve the right to suspend or terminate your account and refuse any and all current or future use of the Sites or the Services or any portion thereof.
Access to Service Via Frontier Precision’s Client
We provide our Frontier Precisionclient applet (the “Client”) as one method to consume our advisory services in an automated, time-saving, and labor-saving manner. The Client will perform the initial analysis and establish a performance baseline for your supported PC(s), checking items like: internet speed, device drivers, security client, and others. The Client also will establish your profile and attempt to auto-detect the hardware connected to your home or local area network and to launch your initial and future optimizations of your system.
This Client is the property of Frontier Precision or its licensees and is protected by copyright law. While Frontier Precision continues to own the intellectual property rights to the Client, you will have certain permission to use the Client after Your acceptance of our Terms of Service. This permission governs any releases, revisions, or enhancements to the Client that Frontier Precision may furnish to you.
Subscriptions, Billing and Cancellation
Ongoing Subscriptions. Your Frontier Precision subscription may year-to-year (depending upon your subscription purchase) unless and until you cancel your subscription or we terminate it. You must have Internet access and provide us with a current, valid, accepted method of payment (as such may be updated from time to time, “Payment Method”) to use the Services. We will bill the term subscription fee to your Payment Method. You must cancel your subscription before it renews, subject to your subscription term at time of purchase, in order to avoid billing of the next terms subscription fees to your Payment Method.
Note that your will be billed any applicable tax automatically in addition to the subscription cost based on applicable laws. Sales tax may be applied based on your residence; if it is not applied you may have an obligation to remit use tax or similar tax. If in the future it is found that you were obligated to pay sales tax for the service you will be charged for your sales tax obligation.
Differing Subscriptions. We may offer a number of subscription plans, including special promotional plans or subscriptions with differing conditions and limitations. Any materially different terms from those described in these Terms of Service will be disclosed during your sign-up or in an Order or other communications made available to you.
Recurring Billing. By starting your Frontier Precision subscription and providing or designating a Payment Method, you authorize us to charge you an annual subscription fee (dependent upon your subscription term) at the then current rate, and any other charges you may incur in connection with your use of the Frontier Precision service to your Payment Method.
Price Changes. We reserve the right to adjust pricing for our service or any components thereof in any manner and at any time as we may determine in our sole and absolute discretion. Except as otherwise expressly provided for in these Terms of Service, any price changes to your service will take effect following email notice to you.
Billing Cycle. The subscription fee for our service will be billed at the beginning of the paying portion of your subscription and each billing term thereafter unless and until you cancel your subscription. We automatically bill your Payment Method each term on the calendar day corresponding to the commencement of your paying subscription. Subscription fees are fully earned upon payment. We reserve the right to change the timing of our billing, in particular, as indicated below, if your Payment Method has not successfully settled. In the event your subscription began on a day not contained in a given mon